How To Make Use Of The Powerful Watch List in C++ Builder
By Yilmaz Yoru December 7, 2021
What is Debugging? in fact, what is a bug? How can I debug in C++ Builder? Is there An Example of how to use Watches? How can I see Watch List Window? How can I add a watch to the Watch List?
или Зарегистрируйся: debugging is the process of finding and resolving bugs in your software applications or hardware systems. Bugs are defined as defects or problems that prevent correct operation in a running system or application.
Many programming languages and software development tools also offer programs to aid in debugging, known as debuggers. Many different Integrated Development Editors (IDEs) in C++ provides very professional techniques and methods to debug applications in different conditions. Debugging involves interactive debugging, control flow analysis, unit testing, integration testing, log file analysis, monitoring at the application or system level, memory dumps, and profiling.
RAD Studio, C++ Builder provides an integrated debugging environment that enables you to debug multi-device applications as well as native Win32 applications. In addition, you can use the debugger to debug an application running on a remote machine that does not have RAD Studio installed.
или Зарегистрируйся enables you to examine various data types such as arrays, classes, constants, functions, pointers, scalar variables, and interfaces. To use the Debug Inspector, select Run > Inspect.
This Для просмотра ссылки Войдиили Зарегистрируйся is a helpful overview.
2. Add two button Button1 and Button2 onto Form
3. Press F12 to switch codes and add int x =0; global variable.
4. Press F12 again and double click to Button1 and double click to Button2 to create OnClick events
5. Modify codes as below
As you see we create a simple application that sets global x variable to 100 when pressed Button1 and to 200 when pressed Button2. Now let’s see how we watch this variable.
или Зарегистрируйся.
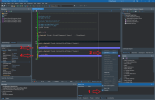
View > Debug Windows > Watch List
Displays the current value of the watch expression based on the scope of the execution point. The Watch List window is a multi-tabbed view with each tab representing a distinct watch group. Only the watch group on the active tab is evaluated while debugging.
Tip: To enable or disable a watch expression quickly, use the check box next to the watch.
Note: The in-place editors on the Watch List window are now clickable dropdown lists. In addition to typing new values in the in-place editors (such as Watch Name), you can also select from values that were entered in this field previously or on other Debug windows.
Note: If the execution point moves to a location where any of the variables in an expression is undefined (out of scope), the entire watch expression becomes undefined. If the execution point reenters the scope of the expression, the Watch List window displays the current value of the expression.
Tip: By grouping watches, you can prevent out of scope expressions from slowing down stepping.

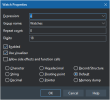
Now we can add x variable as below to watch list. Press OK to finish.

4. Now add a break to the end of Button1Click() by clicking the right side of the code line
5. Add another break to the end of Button2Click() by clicking right side of the code line
6. Now you can run your application in the Run with Debug mode by the button or pressing F9.
By Yilmaz Yoru December 7, 2021
What is Debugging? in fact, what is a bug? How can I debug in C++ Builder? Is there An Example of how to use Watches? How can I see Watch List Window? How can I add a watch to the Watch List?
What is Debugging?
As we mentioned in Для просмотра ссылки ВойдиMany programming languages and software development tools also offer programs to aid in debugging, known as debuggers. Many different Integrated Development Editors (IDEs) in C++ provides very professional techniques and methods to debug applications in different conditions. Debugging involves interactive debugging, control flow analysis, unit testing, integration testing, log file analysis, monitoring at the application or system level, memory dumps, and profiling.
RAD Studio, C++ Builder provides an integrated debugging environment that enables you to debug multi-device applications as well as native Win32 applications. In addition, you can use the debugger to debug an application running on a remote machine that does not have RAD Studio installed.
What is the C++ Builder Debug Inspector?
The Для просмотра ссылки ВойдиThis Для просмотра ссылки Войди
- Stepping – Step by Step Debugging Through Code
- Evaluate/Modify – Investigate Expressions
- Breakpoints – Pause and Check
- Watches – Tracking Values
- Exceptions – Displaying the stack trace
Is there a C++ example to test watches?
1. Let’s create a new VCL Windows application in C++ Builder2. Add two button Button1 and Button2 onto Form
3. Press F12 to switch codes and add int x =0; global variable.
4. Press F12 again and double click to Button1 and double click to Button2 to create OnClick events
5. Modify codes as below
C++:
//---------------------------------------------------------------------------

#include <vcl.h>
#pragma hdrstop

#include "WatchList_Unit1.h"
//---------------------------------------------------------------------------
#pragma package(smart_init)
#pragma resource "*.dfm"
TForm1 *Form1;
//---------------------------------------------------------------------------

int x = 0;

__fastcall TForm1::TForm1(TComponent* Owner)    : TForm(Owner)
{

}
//---------------------------------------------------------------------------
void __fastcall TForm1::Button1Click(TObject *Sender)
{
 x = 100;
}
//---------------------------------------------------------------------------
void __fastcall TForm1::Button2Click(TObject *Sender)
{
 x = 200;
}
//---------------------------------------------------------------------------How do I track values with the RAD Studio Watch List Windows?
Watches let you track the values of program variables or expressions as you step over or trace into your code. As you step through your program, the value of the watch expression changes if your program updates any of the variables contained in the watch expression. We can monitor your watch items in the Для просмотра ссылки ВойдиView > Debug Windows > Watch List
Displays the current value of the watch expression based on the scope of the execution point. The Watch List window is a multi-tabbed view with each tab representing a distinct watch group. Only the watch group on the active tab is evaluated while debugging.
Tip: To enable or disable a watch expression quickly, use the check box next to the watch.
Note: The in-place editors on the Watch List window are now clickable dropdown lists. In addition to typing new values in the in-place editors (such as Watch Name), you can also select from values that were entered in this field previously or on other Debug windows.
| Item | Description |
|---|---|
| Watch Name | Shows the expression entered as a watch. |
| Value | Lists the current value of the expression entered. precedes the value if an external-viewer debugger visualizer is available to display the data. Click the down-arrow to select from the available external-viewer visualizers. |
Tip: By grouping watches, you can prevent out of scope expressions from slowing down stepping.
- If we back to our example we can add a new Watch by the right click in the Watch List Window. If there is no Watch List Window you can make it visible from the View->Debug Windows->Watches … menu or by clicking ctrl+alt+W.
- From the menu select “Add Watch…”

Now we can add x variable as below to watch list. Press OK to finish.

4. Now add a break to the end of Button1Click() by clicking the right side of the code line
5. Add another break to the end of Button2Click() by clicking right side of the code line
6. Now you can run your application in the Run with Debug mode by the button or pressing F9.
What other things can we do with the RAD Studio Watch List?
Right-click the Watch List window to display the following commands:| Item | Description |
|---|---|
| Edit Watch | Displays the Watch Properties dialog box, on which you can modify the properties of a watch. |
| Add Watch | Displays the Watch Properties dialog box, on which you can create a watch. |
| Enable Watch | Enables a disabled watch expression. |
| Disable Watch | Disables a watch expression and so that it is not monitored as you step through or run your program. The watch settings remain defined. Disabling watches improves debugger performance. |
| Delete Watch | Removes a watch expression. This command is not reversible. |
| Copy Watch Value | Copies the text in the Value column of the selected watch to the clipboard. |
| Copy Watch Name | Copies the text in the Watch Name column of the selected watch to the clipboard. |
| Enable All Watches | Enables all disabled watch expressions. |
| Disable All Watches | Disables all enabled watch expressions. |
| Delete All Watches | Removes all watch expressions. |
| Add Group | Displays a dialog box, allowing you to name a watch group and add it to the watch list as a new tab. |
| Delete Group | Deletes a watch group from the watch list. |
| Move Watch to Group | Moves one or more selected watches to another watch group. |
| Inspect | Displays the selected watch item in the Для просмотра ссылки Войди |
| Evaluate/Modify | Displays the selected watch item in the Для просмотра ссылки Войди |
| Visualizers | Enabled when an external-viewer type debugger visualizer is available to display the selected data in a more human-readable way. To display the visualized data, click a submenu item (such as Show Strings for the TStringList visualizer). |
| New Watch | Creates a new watch item from the selected item. This command is enabled for all items except top-level items. |
| Stay On Top | Keeps the window visible when out of focus. |
| Show Column Headers | Toggles the display of the Watch Name and Value column titles. |
| Dockable | Enables drag-and-dock for the Watch List window. |
