TMS VCL Chart
DB-aware and non DB-aware feature-rich charting components for business, statistical, financial & scientific data

или Зарегистрируйся to TAdvChartView with Для просмотра ссылки Войди или Зарегистрируйся

или Зарегистрируйся

Marco Boglione, via email
I have tried your new "TAdvGDIPChartView : GDI+ enabled multi-pane chart component" demo and I am extremely impressed.
I develop applications using Borland Delphi 5 and for years now, the obvious choice for charting components has been TeeChart. Well not any more !!!
I often find that charting components can be a bit clumsy and awkward to use, but your charting components' properties are extremely well laid out and easy to use.
Also, when looking at the GDI plus demo, the quality of rendering and anti-aliasing is world-class.
Other charting components out there advertise lovely, glossy and shiny charts on their web site, but when you run their demos it's a very different story indeed. They are often poorly rendered and produce dodgy anti-aliased drawings, they are over-priced, etc...
So all in all, you certainly have the best charting component that I have ever came across - on the first release and for such a great price !
I was currently looking for a new charting component - well not any more ! I will be recommending that the company that I work for purchases your new charting component.
Dave Scott, via email
Finally, a chart control that hits the sweet spot! As a product, AdvChart has the right approach. It's still very simple to use, the price is perfect, the code is included and easy to modify to taste and things that would be hard to add later or by the user are already taken into account like multiple panes.
Orlando Diaz, via email
After using Tee Chart Pro and RiverCharts for many years it took me sometime to work through the differences with TMS Charts but - now I have worked through the learning curve the TMS Charts certainly deliver. Thanks for yet another great set of components.
David Case, via newsgroup
Home: Для просмотра ссылки Войди или Зарегистрируйся
Copyright © Для просмотра ссылки Войдиили Зарегистрируйся
DB-aware and non DB-aware feature-rich charting components for business, statistical, financial & scientific data

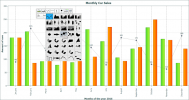
TAdvChartView & TDBAdvChartView : fast multi-pane & DB-aware chart component
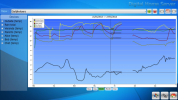
- Single or multi pane chart view component
- Vertical or horizontal oriented charts
- Wide range of chart types: Line, Bar, Area, Pie, Spider, Donut, Band, Stacked Bars, Stacked Area, OHLC, CandleStick, Histogram, Bubble, Error, Digital Line, Funnel ...
- Different bar shapes such as rectangle, cylinder and pyramid
- X-axis with index of date/time unit indication
- Linear or logarithmic Y-scale
- Y-axis with auto ranging, minor & major value indication along Y-axis, multiple Y-axis values for different series supported
- Support for annotations & legend
- Panes with scrolling, scaling, splitter, drag & drop, synchronized scrolling with mouse or keyboard
- Highly configurable crosshairs with value indication at series, Y-axis, tracker & crosshair support along multiple panes
- Navigator bar to help for scrolling series along X-axis
- Floating tracker window to see values at crosshairs
- Configurable grid & bands
- Configurable margins for chart & chart background image
- Printing support, export to bitmap support
- Support for persisting chart settings to file
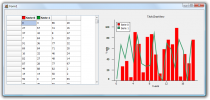
- Interface component to synchronise automatically with TAdvStringGrid / TDBAdvGrid
- DB-aware panes and series
- Includes TAdvChartViewPDFIO component to export Chart to PDF
- Includes popup toolbar to configure series visuals (XE2 and newer)
TAdvGDIPChartView & TDBAdvGDIPChartView : GDI+ enabled multi-pane & DB-aware chart component
- Advanced GDI+ enabled version of TAdvChartView
- Anti-aliased chart drawing
- Complex gradient support
- Support charts with opacity & opacity gradients
- Support for PNG images with alpha transparency for chart markers, textures
- GDI+ hatches for chart fills
- Shadows on bars, lines, areas, legend
- Optional glass mirror effect support
- Zoom control window with full scroll range
- Export charts to .PNG, .JPEG, .GIF, .TIFF or .BMP files
- Includes TAdvChartViewPDFIO component to export Chart to PDF
TAdvChartView3D : OpenGL 3D multi-serie chart component
- High Quality OpenGL 3D Rendering
- Optional AntiAliasing
- Multiple Series
- Pie Chart Type
- Mouse Interaction
- Export to image
- Configurable values with optional image
- Configurable legend & title
- 3D rotation support on X, Y and Z-Axis
Additional tools and information
Automatically connect Для просмотра ссылки Войди
Some sample screenshots of users applications ...
Home automation and multimedia application by Для просмотра ссылки Войди
Comments
Another great TMSSoftware component! And very excellent support and help by the TMS software team.Marco Boglione, via email
I have tried your new "TAdvGDIPChartView : GDI+ enabled multi-pane chart component" demo and I am extremely impressed.
I develop applications using Borland Delphi 5 and for years now, the obvious choice for charting components has been TeeChart. Well not any more !!!
I often find that charting components can be a bit clumsy and awkward to use, but your charting components' properties are extremely well laid out and easy to use.
Also, when looking at the GDI plus demo, the quality of rendering and anti-aliasing is world-class.
Other charting components out there advertise lovely, glossy and shiny charts on their web site, but when you run their demos it's a very different story indeed. They are often poorly rendered and produce dodgy anti-aliased drawings, they are over-priced, etc...
So all in all, you certainly have the best charting component that I have ever came across - on the first release and for such a great price !
I was currently looking for a new charting component - well not any more ! I will be recommending that the company that I work for purchases your new charting component.
Dave Scott, via email
Finally, a chart control that hits the sweet spot! As a product, AdvChart has the right approach. It's still very simple to use, the price is perfect, the code is included and easy to modify to taste and things that would be hard to add later or by the user are already taken into account like multiple panes.
Orlando Diaz, via email
After using Tee Chart Pro and RiverCharts for many years it took me sometime to work through the differences with TMS Charts but - now I have worked through the learning curve the TMS Charts certainly deliver. Thanks for yet another great set of components.
David Case, via newsgroup
Help
- Для просмотра ссылки Войди
или Зарегистрируйся - Для просмотра ссылки Войди
или Зарегистрируйся - Для просмотра ссылки Войди
или Зарегистрируйся - Для просмотра ссылки Войди
или Зарегистрируйся
Copyright © Для просмотра ссылки Войди
