Easily Monitor The Current Windows Process In A Delphi App With Flexible Component Suite
February 10, 2021 By Anbarasan
We have seen how to enumerate among the running processes and services in this blog Для просмотра ссылки Войдиили Зарегистрируйся. How about monitor a particular process in your machine ? How to identify the list of threads, modules, handles associated to a particular process programmatically? Don’t know how to do. Don’t worry. Для просмотра ссылки Войди или Зарегистрируйся System Information Management Suite’s component helps to do that effectively and we will learn how to use the thread TSysProcMonThread to demonstrate the process monitoring.
Platforms: Windows.
Installation Steps:
You can easily install this Component Suite from GetIt Package Manager. The steps are as follows.

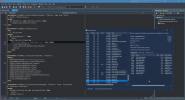
MiTeC Process Monitor Demo
By this way you can monitor any process in your application effectively. Use this MiTeC component suite and get the job done quickly.
Head over and check out the full MiTec System Information Management Suite for Access System Information for Windows in Delphi Applications
February 10, 2021 By Anbarasan
We have seen how to enumerate among the running processes and services in this blog Для просмотра ссылки Войди
Platforms: Windows.
Installation Steps:
You can easily install this Component Suite from GetIt Package Manager. The steps are as follows.
- Navigate In RAD Studio IDE->Tools->GetIt Package Manager->select Components in Categories->Components->Trail -MiTec system Information Component Suite 14.3 and click Install Button.
- Read the license and Click Agree All. An Information dialog saying ‘Requires a restart of RAD studio at the end of the process. Do you want to proceed? click yes and continue.
- It will download the plugin and installs it. Once installed Click Restart now.
- Navigate to the System Information Management Suite trails setup, Demos folder which is installed during Get It installation e.g) C:UsersDocumentsEmbarcaderoStudio21.0CatalogRepositoryMiTeC-14.3DemosDelphi18
- Open the PM project in RAD studio 10.4.1 compile and Run the application.
- This Demo App shows how to list down the running processes and its threads, handles, modules association for the selected process.
- TSysProcMonThread: Monitors system and provides running processes, CPU, memory and disk monitoring and provides system information.
- TListView for viewing running Process list.
- TPanel to show the Threads, Modules, Handles list information in a separate tab sheets for the selected process.
- An instance FSPM of TSysProcMonThread were created. And in regular interval of the thread, Process list refreshed and updated to the screen using the OnInterval Event handler. On each interval, the Process List is refreshed using RefreshProcList.
- On each interval, ThreadList, Modules List, Handles List is refreshed using procedures RefreshThreadList, RefreshModList, RefreshHandleList if a particular process is monitored.
Код:
var
  p: TProcessRecord;
  s: string;
  dt: TDatetime;
  vi: TVersionInfo;
begin
  RefreshProcList;
  Sender.GetRecordByPID(Sender.MaxCPUUsageProcessID,p);
  sb.Panels[1].Text:=Format('Max CPU usage: %s (%d)',[p.Name,p.PID]);

  if FSPM.IsProcessWatched(FRecord.PID) then begin
    FSPM.GetRecordByPID(FRecord.PID,FRecord);
    if lSigner.Tag=0 then begin
      if VerifyFile(FRecord.ImageName,s,dt)=0 then begin
        lSigner.Caption:='(Verified) '+s;
        lSigner.Font.Color:=clBlue;
        lSigner.Font.Style:=[fsUnderline];
        lSigner.Cursor:=crHandPoint;
      end else begin
        GetFileVerInfo(FRecord.ImageName,vi);
        lSigner.Caption:='(UNVERIFIED) '+vi.CompanyName;
        lSigner.Font.Color:=clWindowText;
        lSigner.Font.Style:=[];
        lSigner.Cursor:=crDefault;
      end;
      lSigner.Tag:=1;
    end;
    CPUGauge.Position:=FRecord.Performance.CPUUsage.RoundValue;
    lCPU.Caption:=Format('CPU Usage: %1.2f %%',[FRecord.Performance.CPUUsage.Value]);
    lTitle.Caption:=Format('[%d] %s (%d-bit)',[FRecord.PID,FRecord.ImageName,FRecord.Platform]);
    lCT.Caption:=Format('Created: %s',[DateTimeToStr(FRecord.CreationTime)]);
    lPri.Caption:=Format('Priority: %d',[FRecord.Priority]);
    lMem.Caption:=Format('Memory: %s',[NormalizeDataValue(FRecord.VMCounters.WorkingSetSize/1)]);
    lIORead.Caption:=Format('IO Read Rate: %s/s (Total: %s)',[NormalizeDataValue(FRecord.Performance.IOReadUsage.Delta),NormalizeDataValue(FRecord.Performance.IOReadUsage.Value)]);
    lIOWrite.Caption:=Format('IO Write Rate: %s/s (Total: %s)',[NormalizeDataValue(FRecord.Performance.IOWriteUsage.Delta),NormalizeDataValue(FRecord.Performance.IOWriteUsage.Value)]);
    tsHandles.Caption:=Format('Handles (%d/%d)',[FRecord.HandleList.Count, FRecord.HandleCount]);
    tsModules.Caption:=Format('Modules (%d)',[FRecord.ModuleList.Count]);
    RefreshThreadList;
    if tsModules.TabVisible and ((pc.ActivePage=tsModules) or (ModList.Items.Count=0)) then
      RefreshModList;
    if (pc.ActivePage=tsHandles) or (HandleList.Items.Count=0) then
      RefreshHandleList;
  end;
end;
MiTeC Process Monitor Demo
By this way you can monitor any process in your application effectively. Use this MiTeC component suite and get the job done quickly.
Head over and check out the full MiTec System Information Management Suite for Access System Information for Windows in Delphi Applications
